Chapter 6: Orders of Battle and Unit Ratings
An order of battle is a list of who was there and what they had. Building one is the most research-intensive part of wargame design, and the part where you will spend the most time cross-referencing sources that disagree with each other. The process is straightforward. The challenge is judgment: deciding what level of detail your game needs, what numbers to put on the counters, and when “close enough” is the right answer.
Finding Your OOB
Start with published staff histories. These are the official records kept by military organizations during and after a conflict, and they remain the most reliable primary source for unit identifications, strengths, and dispositions. For the World Wars, the U.S. Army’s official histories (the “Green Books”) are free online and contain detailed OOBs for every major campaign. The British official histories serve the same function. German records are patchier because of wartime destruction, but enough survived to reconstruct most formations through secondary sources.
Beyond staff histories, books are your primary tool. Osprey’s “Battle Orders” series covers unit organization for dozens of campaigns. Nafziger compiled Napoleonic OOBs across multiple volumes. For specific battles, monographs will list participating units in appendices. When you find two sources that disagree on a unit’s strength or composition, check which one cites primary documents and which one is citing someone else’s book. The closer to the original records, the more weight you give it.
The internet has made OOB research faster but not easier. Websites like Niehorster’s WWII organizational histories provide detailed tables of organization and equipment. Forums and wikis can point you toward sources you did not know existed. But online OOBs are often unsourced or copied from each other, and errors propagate. Use the internet to find leads, then verify against published sources.
Level of Representation
Your scale determines what units appear on the map. A tactical game represents battalions or companies. An operational game uses divisions or brigades. A strategic game might use corps or armies. This relationship between scale and unit level is fixed by the logic of the simulation. If your hexes represent twenty kilometers of frontage, individual battalions make no sense as game pieces. If your hexes represent five hundred meters, army-level counters make no sense either.
The gray area is in the middle. An operational game at ten-mile hexes could use brigades or divisions. The choice depends on what decisions you want the player to make. If the player should worry about committing reserves at the divisional level, use brigades. If the player’s decisions are about where to commit corps, use divisions. The unit level on the counter should match the command level the player occupies.
There is a practical constraint too. More counters means more setup time, longer turns, and a bigger map. A game with 400 brigade counters plays differently from one with 80 division counters covering the same campaign. Both can be good. Know which experience you are building toward.
What Goes on the Counter
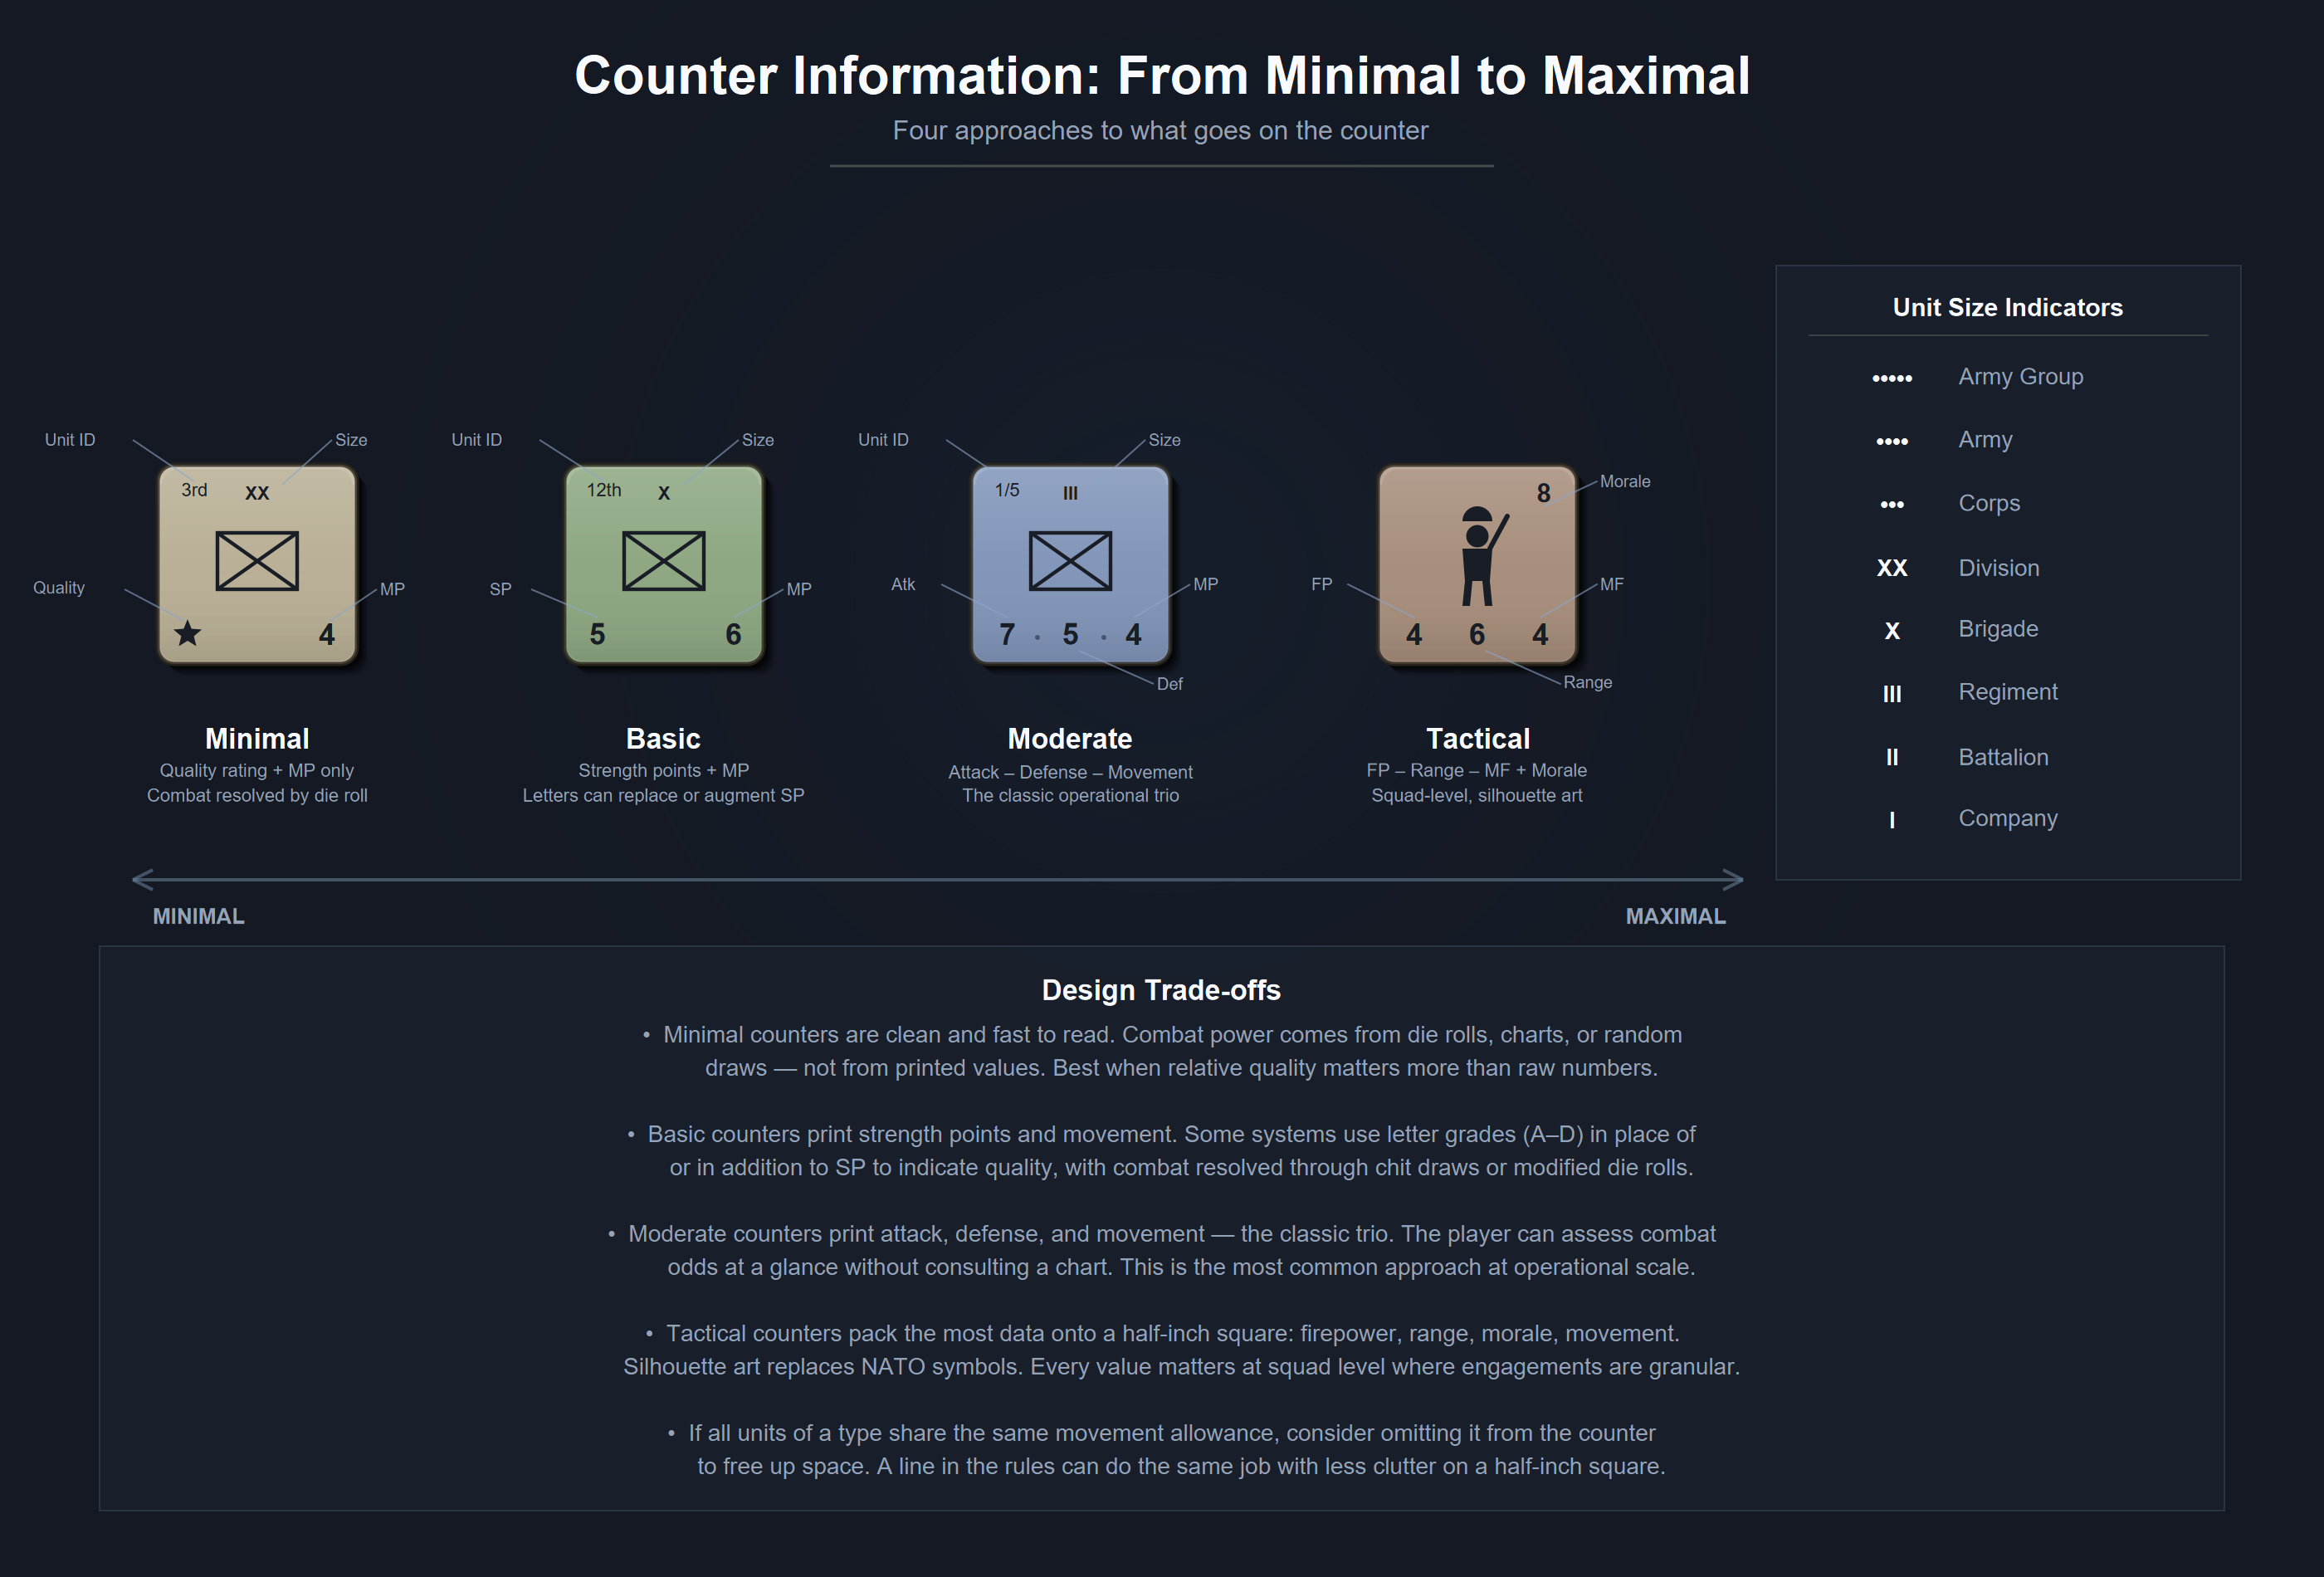
Counter design falls on a spectrum. At one end, games like Unconditional Surrender put almost nothing on the counters. Unit identity and combat values live on tracks and charts. The counters are markers that show position. At the other end, some tactical games print attack strength, defense strength, movement points, range, morale rating, and unit identification all on a single half-inch square.
Both approaches work. You pick based on how much information the player needs at a glance versus how clean you want the counter to look.
I tend toward less information on the counter rather than more. Koniggratz and Mars La Tour, two of my games based on Mark Herman’s Gettysburg system, have no strength points on the counters at all. Units show movement points and an Efficiency Rating (zero, one, or two stars) that modifies an opposed die roll. There are no strength points. The player figures out combat power from the dice and DRMs, never from the counter. That is the extreme end of the spectrum, but it works for division-level games where relative quality matters more than raw numbers. If all infantry units in your game move at the same rate, you do not need to print movement points on every infantry counter. A line in the rules that says “infantry moves 4” does the same job without cluttering the counter. Print movement allowances on the counter when different units of the same type move at different speeds and the player needs to see that at a glance.
The minimum information a counter needs is identification (what unit is this?) and something that distinguishes it from other units in play. Everything else is a design choice. Attack and defense values on the counter let the player assess combat odds without consulting a chart. But those same values on a separate reference card can work if your counter art is cleaner without them. Playtest both if you are unsure. You will know which one your game wants.
Strength Points: Headcount vs. Combat Effectiveness
New designers assume that a unit’s strength points should reflect its headcount. A division of 15,000 men is stronger than a division of 10,000, so it should have more strength points. This logic is reasonable and often wrong.
Headcount is one factor in combat effectiveness, and seldom the most important one. A full-strength division with no fuel cannot attack. A division at 60% strength with veteran troops, functioning logistics, and air support will destroy a full-strength division of untrained replacements who ran out of ammunition two days ago.
Dupuy spent decades quantifying this through his Quantified Judgment Model. His factors include training, morale, logistics, leadership, equipment quality, air support, and surprise. The QJM’s combat effectiveness values for national armies in World War II show German forces averaging 20% higher combat effectiveness than their Western Allied opponents at equivalent strength, and higher still against Soviet forces in the early war years. Zetterling’s study of Normandy 1944 confirmed this pattern through a different methodology: German units on average inflicted more casualties per soldier committed than Allied units, whether attacking or defending, even when outnumbered.
You do not need to replicate Dupuy’s math. You need to understand what it tells you: a strength point should represent combat power, and combat power is a composite of many things. A German panzer division and a Soviet rifle division might both have 10,000 men, but giving them the same strength points produces a game that does not look like the Eastern Front.
How you handle this depends on your system’s abstraction level. Some options:
Bake it into the strength point. The German division gets 8 SP and the Soviet division gets 5. Simple. The combat system does not need to know why one is stronger. This works at operational and strategic scale where you want fast resolution.
Separate quality from quantity. Give both divisions similar strength points reflecting headcount, but let quality show up elsewhere. Armor attacking in open terrain gets a column shift regardless of nationality. Soviet units in a Barbarossa game might have lower movement ratings in the opening turns to reflect the organizational chaos of June 1941, or lose their first turn entirely. Quality modifiers should be subtle. A small edge repeated across many combats produces the right aggregate result without making individual battles feel predetermined.
The Procedural Combat Series takes this further. PCS counters have no printed combat strength at all. Each unit carries a Unit Quality Rating from A to D. At the moment of combat, both sides draw a random chit from a cup and cross-reference it against their UQR to determine how hard they hit. The UQR on the counter tells you how good a unit is. The chit tells you how its day is going. A “D” unit occasionally draws a strong chit and fights above its weight. An “A” unit occasionally draws poorly. Over many combats the ratings sort themselves out, but any single engagement carries real uncertainty.
Use distinct ratings for distinct capabilities. Attack strength, defense strength, and movement allowance can all differ. A unit that is good on the attack might be mediocre on defense. This adds counter complexity but captures asymmetries that a single strength point cannot.
The more tactical your game, the more granularity you need. A squad-level game should distinguish between a veteran squad and a green squad in multiple ways: firepower, morale, initiative. A strategic game covering an entire war can collapse all of that into a single number and let theater-level modifiers handle the rest.
The Technology Problem
Rating hardware is where I have the least natural instinct and where I have learned the most from other designers.
When I was designing a World War I naval game, I had no idea how to rate warships. Jack Greene, who had spent years on this problem, told me the starting point was shell weight multiplied by rate of fire. That gives you a raw measure of how much steel a ship can throw at an enemy in a given time period. From there you adjust for armor penetration, fire control quality, and speed. The formula is rough but it produces relative ratings that hold up against historical engagements.
Technology ratings matter most in periods where hardware created decisive asymmetries. Ancient and medieval combat was dominated by training, morale, and numbers. The Macedonian phalanx did not beat Persian infantry because the sarissa was a superior weapon in isolation. It won because the phalanx formation, backed by years of drill and Philip’s organizational reforms, created a system that Persian infantry could not answer.
After the Industrial Revolution, and more so after World War I, hardware starts to dominate. A Tiger tank and a Sherman tank are different weapons with different capabilities, and your game needs to reflect that difference. Penetration values, armor thickness, and engagement ranges become design inputs. For naval games, the differences between a dreadnought and a pre-dreadnought are so large that the ratings almost write themselves.
For land games at operational scale, I find that technology differences are better handled through combat modifiers than through individual unit ratings. German armor quality in 1941 was not superior to Soviet armor on a tank-by-tank basis. The T-34 was a better tank than anything the Germans fielded that year. The German advantage was in combined arms coordination, radio communication, logistics, and leadership. Modeling this through a technology rating on the counter misses the point. Model it through combat system modifiers, or through the command and activation systems that let German units respond faster and coordinate better.
Sedan 1940 is where I worked this out most deliberately. The game uses three armor classes encoded visually on each counter by the shape around its movement allowance. No marking means Light: foot infantry, artillery, anti-tank guns. A circle means Medium: motorized infantry, armored cavalry. A square means Heavy: tanks and aircraft. When a unit fires, the player cross-references its weapon type against the target’s armor class on a national combat matrix. German and French forces use different matrices. German primary fire against Heavy targets gets a x0.5 multiplier. French primary fire against the same Heavy targets gets x1. French secondary fire against Light targets gets x2.5, reflecting a defensive doctrine built around strong anti-personnel firepower. Neither side’s secondary weapons can touch Heavy armor at all.
The matrices encode how German and French forces fight, not which side has better tanks. The German player’s edge comes from Luftwaffe support, more division activation chits in the cup, and an opponent saddled with reserve divisions that take column shift penalties in assault combat. The French player’s edge is raw defensive firepower at close range. The technology asymmetry lives in the combat system, not on the counters, and it produces the right operational pattern: German combined arms breaking through French positions that are strong on paper but brittle under coordinated pressure.
Balancing Accuracy and Playability
A good designer finds the point where accuracy and playability reinforce each other. They operate under different constraints, but the best games satisfy both.
Mark Herman’s Gettysburg game, published through C3I and inspired by SPI’s classic Napoleon at Waterloo, illustrates this. Herman represented Confederate units as half-divisions and Union units as divisions. On the map, this gives the Confederacy more counters than the Union, creating a visual impression of numerical superiority that did not exist in historical terms. The CSA was outnumbered at Gettysburg.
But Herman was not making a mistake. The half-division representation captures something about how the Army of Northern Virginia operated. Lee’s army was organized into smaller, more flexibly commanded formations than Meade’s. The extra counters give the Confederate player more operational flexibility: more units to maneuver, more options for concentration and dispersal. The Union player has fewer, stronger pieces that hit harder individually but offer less positional flexibility. The visual “inaccuracy” produces gameplay that reflects the actual operational character of both armies better than a strictly proportional counter mix would.
You can rationalize apparent inaccuracies in your OOB if they serve the simulation. A unit that is “too strong” on paper might produce the right combat results when it interacts with your CRT and terrain modifiers. A formation that is split into two counters when it was historically one entity might generate the right command decisions for the player. The test is whether the game reproduces historical patterns of action and result, not whether every number on every counter matches a table in an order of battle reference.
The Real Test
There does not need to be rigid logic in building an OOB. I know designers who want a mathematical formula that converts historical data into strength points with mechanical precision. I have never found one that works across more than a single game.
You gather the best data available, assign numbers that reflect relative combat power, and playtest. If the 1st Panzer Division underperforms what you know it should do based on its historical record, you adjust its rating. When the game produces a front line that looks nothing like the historical campaign, check the numbers against the history. Either the OOB or the combat system is off.
Apply numbers in a way that should reproduce the effects you want to see under the constraints you have built. I have no better rule for unit ratings than that.
Case Study: Prigozhin’s March of Justice
In June 2023, Yevgeny Prigozhin led Wagner Group mercenaries on a mutiny march from Rostov-on-Don toward Moscow. The event lasted about 36 hours, all of it playing out live on social media and television. As a simulation subject, it was unusual: a small number of identifiable units, a well-documented timeline, and an outcome that hinged on political decisions rather than combat.
The OOB was manageable. Wagner Group forces numbered roughly 8,000 men organized into a handful of identifiable columns. Russian military and security forces along the route included Rosgvardia (National Guard) units, regular army formations at scattered garrisons, and whatever could be scraped together and positioned on short notice. The total number of game pieces was small.
The rating challenge was relative quality within the Wagner contingent. These were mercenary units with combat experience in Ukraine, Syria, and Africa. By reputation, one formation was considered superior to the others. In absolute terms, as professional military forces measured against a modern army, all of them had serious limitations. The design question was whether to rate them high based on their self-image and media reputation, or to rate them as the irregular, poorly institutionalized force they were.
I split the difference. The standout unit got a higher rating than the rest, reflecting its reputation and track record. The remainder got ratings that made them competent against the poorly motivated garrison forces along the route but not dominant against organized resistance. In the design notes, I was honest: these are all subpar formations by any conventional military standard, and the ratings reflect relative capability within that band rather than comparison to professional armies.
The game’s signature mechanic also solved a rating problem. Each Wagner unit sits on a Maneuver/Combat Track where the player allocates SP versus MP each turn. Push a unit toward combat power and it hits harder but moves less. Push it toward maneuver and it covers ground but fights weaker. The player decides each turn how hard a unit can hit, which captures the real tradeoff between speed and fighting capability on a forced march.
The OOB worked because the game’s scope was narrow. With a dozen or so units on the map, each rating carries weight. In a game with 200 counters, a single unit being a point too strong or too weak disappears into the noise. In a game with 12 counters, it changes the outcome. Small games demand more precision in relative ratings even as they forgive more abstraction in absolute terms.
The March of Justice OOB also illustrates the value of working from well-documented events. I could watch footage of the march, read real-time reporting, cross-reference locations and timelines, and build an OOB with reasonable confidence in a few days. Compare that to reconstructing a Napoleonic corps from fragmentary archival sources that disagree on battalion strengths by 30%. The research burden scales with the age and obscurity of the conflict, and beginning designers should account for that when choosing subjects.
Sources and Further Reading
- Dupuy, Trevor N. Numbers, Predictions and War. Indianapolis: Bobbs-Merrill, 1979.
- Nafziger, George F. Imperial Bayonets. Novato: Presidio Press, 1996.
- Zetterling, Niklas. Normandy 1944: German Military Organization, Combat Power and Organizational Effectiveness. Winnipeg: J.J. Fedorowicz, 2000.
- U.S. Army. FM 101-10, Staff Officers’ Field Manual. Washington: Department of the Army, 1959.