Producer Fingerprint & Other Deep Dives
Does the Producer Change the Fingerprint?
Three different professional producers worked on Ray’s material. Does their involvement show up in the data, or is the fingerprint always Ray’s?
| Producer | Album | Trk | n/s | BPM | Ambig% | Sus2% | Maj% | Maj7% | Bass% |
|---|---|---|---|---|---|---|---|---|---|
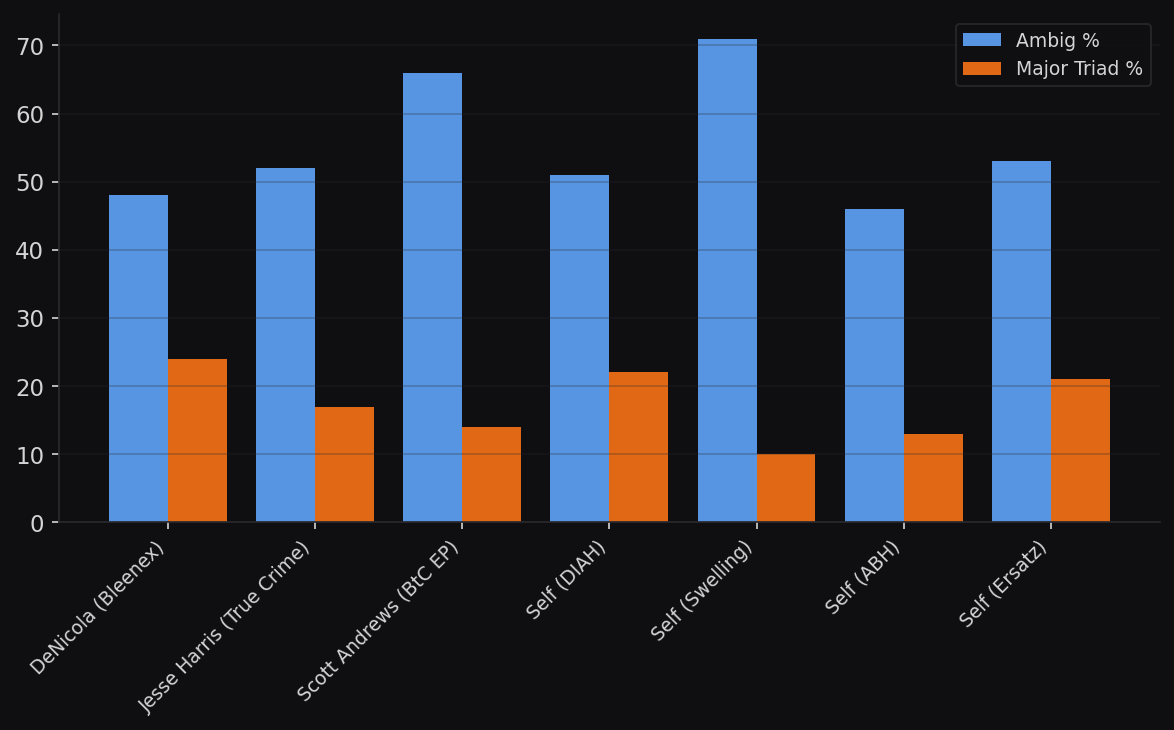
| DeNicola | Bleenex (2007) | 13 | 8.3 | 202 | 48% | 7% | 24% | 6% | 61% |
| Jesse Harris | True Crime (2014) | 12 | 9.2 | 206 | 52% | 8% | 17% | 2% | 62% |
| Scott Andrews | BtC EP (2012) | 4 | 6.7 | 203 | 66% | 3% | 14% | 3% | 72% |
| Self | DIAH (2014) | 7 | 8.9 | 205 | 51% | 3% | 22% | 3% | 53% |
| Self | Swelling (2014) | 11 | 6.7 | 200 | 71% | 5% | 10% | 2% | 63% |
| Self | ABH (2020) | 13 | 9.1 | 201 | 46% | 7% | 13% | 6% | 61% |
| Self | Ersatz | 5 | 8.5 | 207 | 53% | 2% | 21% | 2% | 60% |
Findings
“Harmonic ambiguity” here refers to chord events where the MIDI transcriber could not detect a clear third — closely correlated with the power chord idiom but not literally a count of intentional power chord voicings. See Chord Vocabulary for details.
1. DeNicola brought out the most harmonic richness. Bleenex has the highest major triad percentage (24%) and highest major 7th percentage (6%, tied with ABH) of any album. For a debut record by a self-taught guitarist, that’s unexpected harmonic sophistication. The harmonic ambiguity rate is also the lowest for any 2007-2014 album (48%). DeNicola’s production may have encouraged (or captured) fuller chord voicings.
2. Jesse Harris brought density and sus2. True Crime is the densest album (9.2 n/s) with the highest sus2 usage (8%). Harris produced Norah Jones’ “Don’t Know Why” — a song built on jazzy suspended harmonics. His ear may have pulled more of the sus2 character out of Ray’s playing, or the full-band BtC arrangement created space for it.
3. Scott Andrews produced the most bass-heavy record. BtC EP: 72% bass register — the highest in the catalog. Ray was playing both guitar and drums, and Andrews was engineering. The bass-heaviness may reflect the dual-instrument recording setup.
4. Self-produced Swelling is the most harmonically ambiguous. 71% harmonic ambiguity, only 10% major triads. Alone in Bangkok, the detectable harmonic vocabulary narrowed to its most essential form. No producer or bandmate to encourage variety.
5. Self-produced ABH is the most mature. Lowest harmonic ambiguity rate (46%), highest major 7th (tied at 6%), and the only album with positive rhythmic regularity (0.0114 — barely above metronomic zero, suggesting more deliberate timing). Six years after the last studio record, Ray’s self-produced work became more harmonically sophisticated than any producer had achieved.
The Answer
The producer modulates the fingerprint but doesn’t change it. Harmonic ambiguity ranges from 46-71% across all producers including self-produced work. The bass-heavy register is constant (53-72%). The tempo is locked at 200-207 BPM regardless of producer. The core identity is stable; what shifts is how much harmonic detail gets expressed — and that has as much to do with the era as the producer.
Vocals vs Instrumentals
The SoundCloud instrumentals (albert-liberto account) represent Ray writing without the constraint of vocals. Does the absence of singing change the musical approach?
| Category | Tracks | n/s | BPM | Ambig % | Sus2 % | Major % | Bass % |
|---|---|---|---|---|---|---|---|
| Vocal albums (studio) | 56 | 7.8 | 199 | 55% | 6% | 14% | 60% |
| SoundCloud instrumentals | 35 | 7.4 | 200 | 54% | 6% | 8% | 57% |
Almost identical. Same density, same tempo, same harmonic ambiguity rate, same sus2 usage. The only notable difference: major triad usage drops from 14% to 8% in the instrumentals. Without vocals demanding harmonic resolution points, the music stays more ambiguous — fewer moments where the chord commits to major.
Key centers shift slightly: vocal material centers on E/G/A (open-string dominant), instrumentals on G/E/D (brighter, D-string territory). But the fingerprint is the fingerprint whether or not anyone is singing.
Nuke Whales — The Presidential Musical Rankings
44 songs about 44 presidents. Each president gets their own musical treatment. The question: which presidents got the most musical effort?
Most Musical Effort (highest density)
| President | Notes | Duration | n/s | BPM |
|---|---|---|---|---|
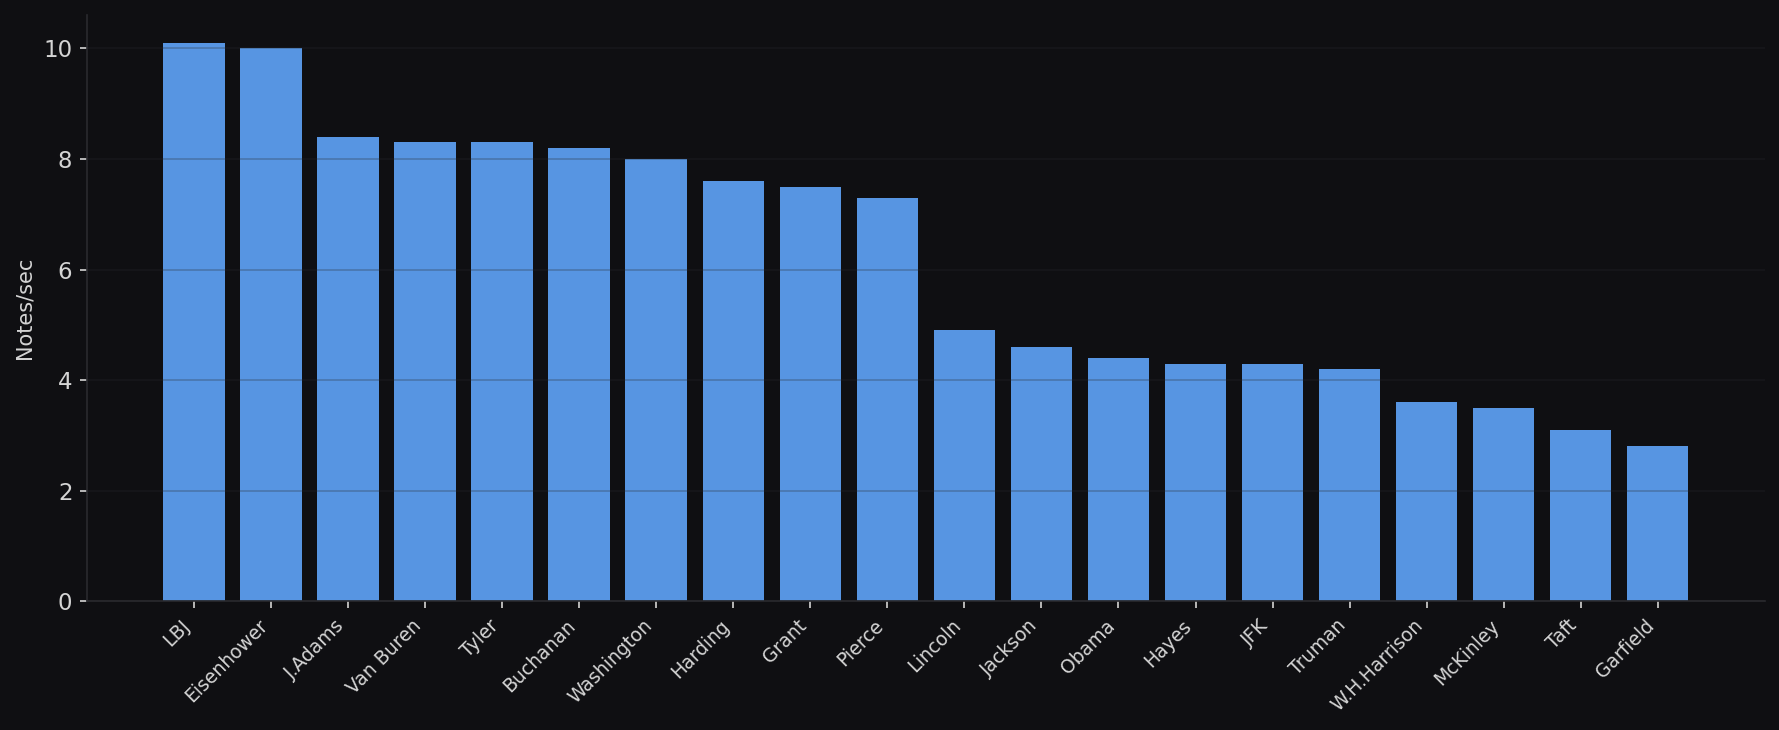
| Lyndon B. Johnson | 509 | 51s | 10.1 | 217 |
| Dwight D. Eisenhower | 487 | 49s | 10.0 | 206 |
| John Adams | 247 | 29s | 8.4 | 197 |
| George Washington | 520 | 65s | 8.0 | 215 |
Least Musical Effort (lowest density)
| President | Notes | Duration | n/s | BPM |
|---|---|---|---|---|
| James A. Garfield | 30 | 11s | 2.8 | 179 |
| William Howard Taft | 185 | 60s | 3.1 | 193 |
| William McKinley | 143 | 41s | 3.5 | 163 |
| William Henry Harrison | 20 | 5s | 3.6 | 178 |
The Historical Jokes
- William Henry Harrison gets 5 seconds and 20 notes — he died 31 days into office
- Ronald Reagan gets the longest song (109 seconds) — the most complicated presidency gets the most runtime
- James A. Garfield gets 11 seconds — assassinated 200 days in
- LBJ gets the highest density (10.1 n/s) — maybe the Vietnam-era intensity demanded it
Averages
- 250 notes per president, 41 seconds, 6.1 n/s
- Total: 11,010 notes across 44 presidents
- William Henry Harrison’s song-to-tenure ratio: 5 seconds of music for 31 days in office